Updated 2026-09-29. This note first described versions 1 to 3 in June 2026. In September I rebuilt the project from scratch and rewrote the note along with it. The old code is tagged
v3-finalin the repository.
Why I rebuilt it
The idea behind the lab has not changed: a quant demo should show the research process, not just the equity curve that survived it. The v3 version got that idea across, but I stopped liking almost everything about how it was carried out.
The art did not fit the camera. The characters had been redrawn as tall, film-proportioned anime figures and then shrunk onto a top-down office map, so six tiny people with long legs slid across a floor plan. The storyboard was mostly that sliding plus text boxes. Under the surface, the backtest engine ran in the browser in TypeScript and was partly re-implemented in Node scripts for the strategy horse race, so the same computation existed twice. And the headline numbers were flattered by the data: the 20-year backtests used today's index members, so every stock in the universe was, by construction, one that survived.
So I kept the premise and replaced the rest: the characters, the art, the front end, the engine, and the investment rules the engine enforces.
From an office to a club
Version 4 is set in the Quant Research Club of a fictional Stellar Orbit Academy. There are six members, one for each step of the research pipeline, and the player is the club's faculty Advisor.

- Hoshino Akari proposes hypotheses. She is the LLM researcher.
- Shiraishi Shiori checks the data and runs a look-ahead fuzz test on every formula.
- Kujo Ren runs the backtest.
- Himura Saki reviews costs, drawdowns, capacity and stability.
- Kurobane Iori is the statistics skeptic: standard errors, the deflated Sharpe ratio, shrinkage and factor attribution.
- Minazuki Mio is the club president and portfolio manager, and makes the call.
The personalities follow the jobs. Iori is a chuunibyou who talks about "the curse of multiple testing", but every one of his lines carries a number from the audit. Saki is strict, and hitting her with the squeaky hammer in the UI raises every gate threshold by 4%.
All of the art is new: a lineup to fix the style, knee-up portraits with six expressions per character, 22 chibi poses per character at two heads tall, five backgrounds and a key visual. I generated it with the Codex image tool on a flat green screen, and every prompt is in art/jobs.py. A short Python script keys out the green, cleans the green fringe, cuts each 2×4 chibi sheet into single poses, scales every pose to the same standing height and pins the feet to one anchor. The expression portraits are edits of one base image, so they line up pixel for pixel and a change of expression is just a crossfade.

How a meeting is staged
Each research meeting is one "pull", and it plays from a fixed shot list. The engine streams events over a WebSocket, and a director on the front end turns each event into shots and paces them so a person can read along.
- Title card: "Research Meeting #N".
- Wide shot: everyone walks to the round table. The chibis find a path around the furniture and hop as they walk.
- Visual-novel shot: the hypothesis, told as an exchange between two portraits. The speaker lights up and changes expression; the listener dims.
- Wide shots: each reviewer walks to their own station and acts out the check, with a speech bubble and a manga symbol overhead.
- Reveal: the backtest card draws its equity curve and counts the Sharpe ratio up.
- Cut-in: the verdict. A speed-line band, a close-up of Mio, and a 採用 (adopted), 保留 (reserve) or 却下 (rejected) seal stamped onto the screen.
- On adoption, a gacha-style rarity reveal.




The Log page can replay any meeting, because the engine stores the full event stream. That is how I recorded the video at the top.

The engine
The engine is now written in Python, and the front end only renders.
- Data. Daily bars from Yahoo, adjusted for total return, plus the 13-week T-bill rate for cash. The stock universe is the S&P 500 with point-in-time membership, including companies that were later removed: a stock can only be traded on days it was actually in the index. Two smaller universes cover 24 multi-asset ETFs and the nine sector ETFs.
- Formulas. Ideas are written in a small expression language, for example
rank(resid_mom(252, 21)) - 0.5 * rank(vol(63))orwhere(trend(200) > 0, tsmom(126), 0) * inv(vol(21)). It is parsed with Python'sastmodule against a whitelist, so the LLM and the genetic miner can write formulas but never code. Every operator only looks backwards, and Shiori's fuzz test checks it: cut the history at two dates, recompute, and fail the formula if any past value changes. - Backtest. The signal is formed at the close and the trade happens at the next open. Positions held overnight earn the gap, new positions earn from the open, cash earns the bill rate, shorts pay a borrow fee, and a stock whose data ends mid-position is closed with a haircut. Spreads widen with volatility and narrow with liquidity, and market impact follows the square-root law. A capacity curve shows how the Sharpe ratio decays as capital grows.
- Ideas. They come from four places: the LLM (the Claude Code CLI, then the Anthropic API, then the Codex CLI, whichever is signed in), a library of 16 documented return mechanisms with references, a genetic miner, and rule-based refinements of near misses. A Thompson-sampling bandit picks the next source, and the Advisor can type an order that jumps the queue.
Rarity is a posterior
The part I care about most is how a strategy gets adopted, because that is where ordinary backtests mislead.
A strategy's rarity (N, R, SR or SSR) is its expected live Sharpe ratio: the backtest Sharpe shrunk toward the population of everything the club has tried, under an empirical-Bayes normal model.
E[SR_live] = m + τ² / (τ² + se²) · (SR_backtest − m)Here m and τ² are estimated from every comparable trial in the registry and blended with a prior that depends on the economic mechanism the idea claims: a risk premium, a behavioral error, a structural friction, or nothing at all. se is the standard error of the Sharpe estimate with skew and fat tails included. If most pulls are noise, τ² is small and every result is shrunk hard. More pulls means a higher bar. That is the honest version of a gacha game: the market has no pity counter.
That number is one gate among several. A strategy also needs a t-statistic of at least 2 over the research period, a positive Sharpe in both the training and the validation halves, at least half of its gross Sharpe left after costs, profits in most years (and still without its best year), a deflated Sharpe ratio above 0.9 where N counts every pull including each evaluation the genetic miner made, and low correlation with what the fund already holds. The last two years of data are sealed in a lockbox and opened exactly once, after everything else has passed.
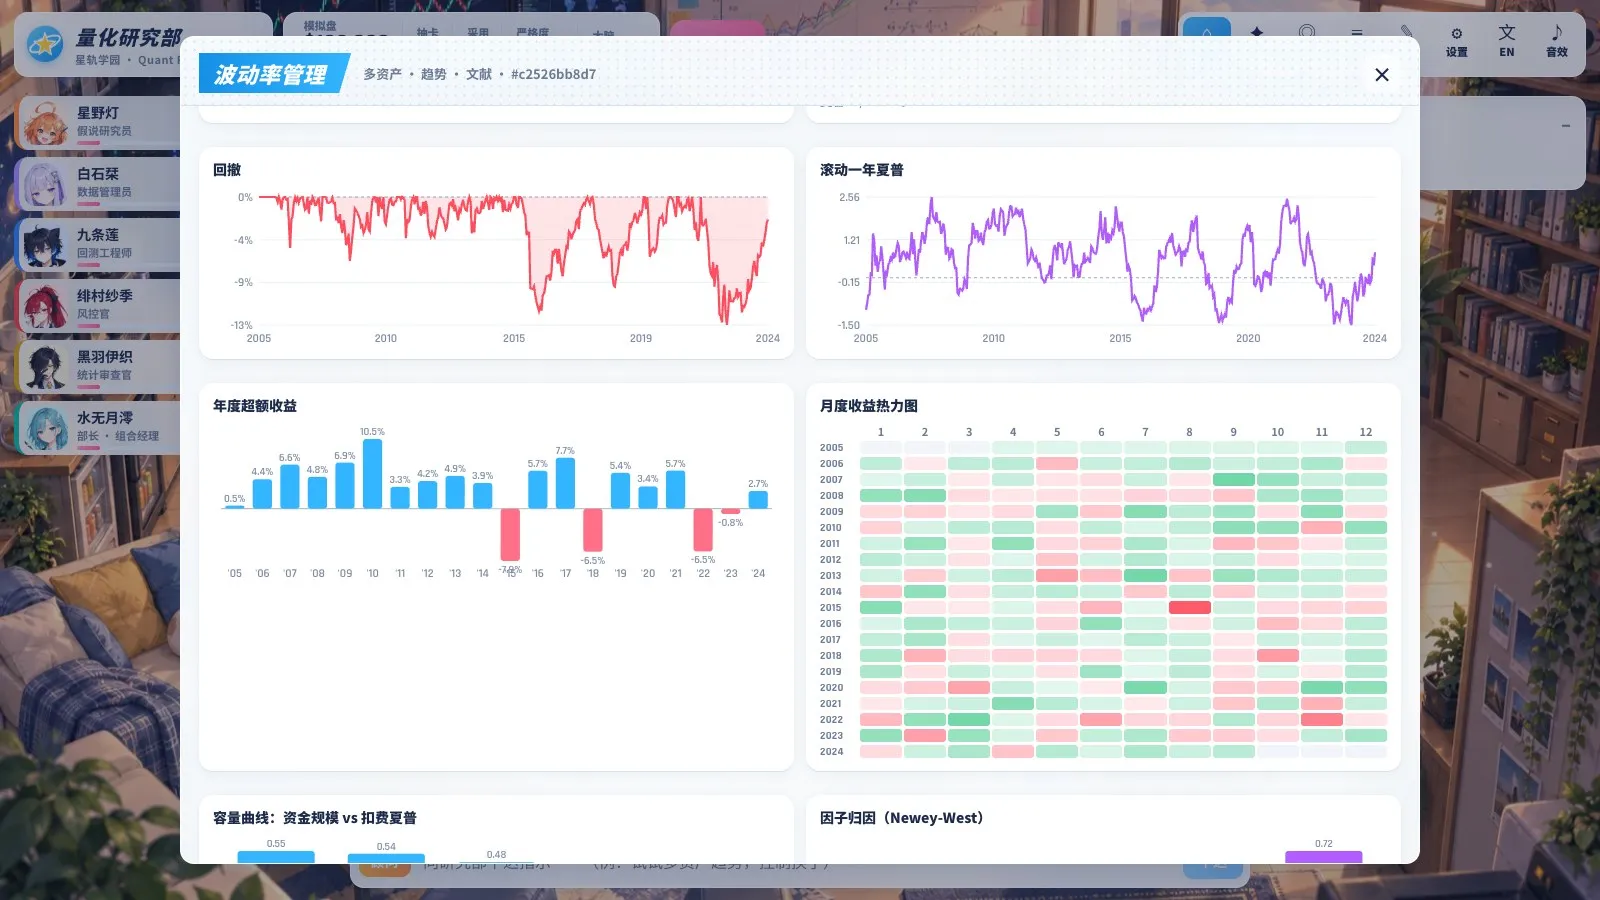
One gate came out of the first real runs. An illiquidity strategy passed everything with a 0.66 Sharpe, and the attribution showed it was almost pure size exposure, with a loading of 0.99 on the small-minus-large factor. The free data is missing about 300 historical index members, and the ones that disappeared were mostly small companies that were delisted. A strategy that earns its living by leaning into small stocks is being flattered by the data itself, so books with a significant size tilt now go to reserve instead of into the fund.
What it found
I ran each family in the library once on a fresh club, from 2005 up to the lockbox. Sharpe ratios are annualized and in excess of the bill rate.
| Family | Universe | Gross SR | Net SR | E[live SR] | Verdict |
|---|---|---|---|---|---|
| Cross-sectional momentum | S&P 500 | 0.03 | −0.06 | 0.08 | reject |
| Residual momentum | S&P 500 | 0.06 | −0.03 | 0.09 | reject |
| Short-term reversal | S&P 500 | 0.82 | −0.06 | 0.10 | reject (costs) |
| Low volatility | S&P 500 | −0.15 | −0.21 | 0.02 | reject |
| 52-week high | S&P 500 | −0.05 | −0.15 | 0.02 | reject |
| Lottery demand (MAX) | S&P 500 | −0.24 | −0.45 | −0.13 | reject |
| Seasonality | S&P 500 | 0.16 | −0.05 | 0.06 | reject |
| Illiquidity | S&P 500 | 0.76 | 0.66 | 0.40 | reserve (size tilt) |
| Time-series momentum | Multi-asset | 0.43 | 0.39 | 0.35 | reject (t = 1.7) |
| Moving-average trend filter | Multi-asset | 0.58 | 0.53 | 0.40 | adopt R |
| Risk parity | Multi-asset | 0.50 | 0.49 | 0.40 | adopt R |
| Cross-asset rotation | Multi-asset | 0.21 | 0.20 | 0.22 | reject |
| Sector rotation | Sector ETFs | 0.08 | −0.02 | 0.09 | reject |
The results agree with the academic literature. The published cross-sectional anomalies in large US stocks are largely gone once you pay real costs: short-term reversal has a 0.82 gross Sharpe and turns negative after 78x annual turnover. Cross-asset trend following and risk parity still work, with drawdowns of about 13 to 15 percent. Long-only stock picks are measured against an equal-weight basket traded on the same schedule, so the market's own drift does not count as skill.
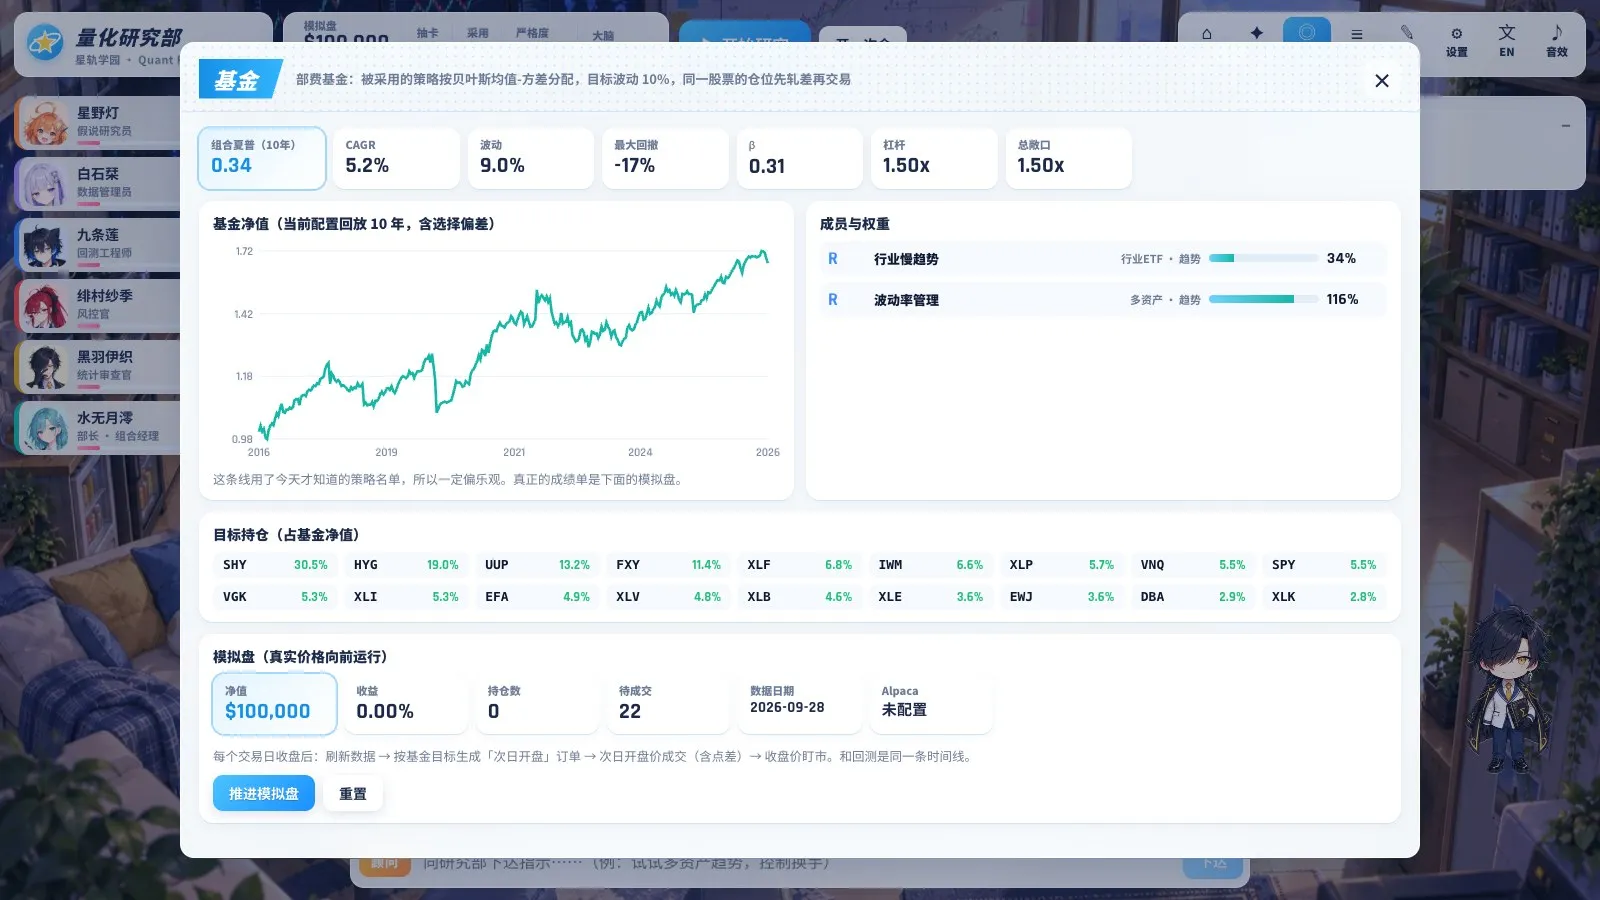
When I let the club run on its own with the Codex brain, it adopted 2 strategies in 29 pulls: a volatility-managed trend filter on the multi-asset ETFs and, after I typed "try trend on sector ETFs, keep turnover low", a slow moving-average trend on the sector ETFs. The fund combines adopted strategies with Bayesian mean-variance weights and a 10% volatility target. A paper book trades the fund forward: orders after the close and fills at the next open, the same timeline as the backtest.
What I learned
The storyboard mattered more than the art. v3 had decent illustrations and still looked wrong, because tall sprites on a floor plan break the camera. Chibi characters in a room and full portraits for dialogue is a convention anime games settled long ago, and it works because each shot has one clear job.
Honest statistics make the game harder and more worth playing. Most pulls are rejected, and most of the rejections are right. An R card means something because an SSR is rare.
Many of the unflattering results came from the data rather than the models. Point-in-time membership, next-open fills and realistic spreads took strategies that looked good in v3 and made them negative. Nothing in the lab guarantees a profit. What it can do is refuse to bet on noise and refuse to pay costs for premia that are not there.
Repository: quant-research-lab · release v4.0.0. Paper trading only; not investment advice.